Midway through his first season in charge of Manchester United, Louis van Gaal wanted answers.
Specifically, the festive period of 2014 was approaching and Van Gaal wanted to understand why the squad had struggled so much during the same period the previous year under David Moyes, including two embarrassing cup losses to Sunderland and Swansea City.
So, Manchester United’s performance science team began investigating.
“My role at United at the time was head of recovery and regeneration,” says Robin Thorpe, now director of sports science at the Red Bull group in Los Angeles, where he works across the organisation’s sporting stable. “It was my main role at the time to make sure I could develop intelligence systems that helped the head coach make better decisions when it came to players’ fitness and fatigue.
“Van Gaal, as an example, would want a report three days before every game: how did the players respond from the last match? On the one level, there would be quite in-depth surveillance and tracking data and intelligence designed for the support staff. At another, mainly for the coaches, there would be a quite simplistic list of players, and a rating of how well they’ve recovered.
“He’d ask questions sometimes — if we’d won the game by a certain point in the match, who would be the best person to take off to save their legs? He’d be using all this information in his decision-making.”
Thorpe was part of the team that began researching the Christmas period, including comparing the club to their top four challengers. The differences they found were stark, as were the implications.
Here, using research shared by Thorpe, The Athletic explores the science of rotation.
When players get injured — Arsenal’s Bukayo Saka, limping off against Crystal Palace, being the latest high-profile example — a common narrative is that there are ‘too many games’. The congested period of English football around Christmas is seen as particularly high-risk.

Saka picked up an injury against Crystal Palace during this festive period (Julian Finney/Getty Images)
But data from CIES Football Observatory shows that the number of fixtures has not significantly risen, on average, over the past two decades — in the 2023-24 season, only four per cent of clubs analysed played more than 60 games, compared to 5.1 per cent in 2012-13 — and the number of games during the Christmas period has remained relatively constant over the past decade. What really matters with stress and load on a player is ‘game sequencing’.
“If you play 10 games across 30 days, evenly spaced across that period, compared to playing 10 games across 30 days, with seven games in the final two weeks, that’s going to elicit a very different stress response — physically and mentally,” explains Thorpe.
“When you have a short time between matches, consecutively, that sequence is demanding, especially compared to the traditional match exposure of one game a week. So when we talk about fixture congestion, what we’re really talking about is these multiple match exposures with small recovery times between them.
“This starts to reduce your ability to recover. You reach a point where you can refill the bucket only to a certain level. And when you’re in that sequence, it’s going to reduce and reduce and reduce until you’re at a point where there’s a far higher likelihood of not maintaining performance.”
This is why coaches can be vocal about seemingly minor fixture amendments. Former Liverpool manager Jurgen Klopp, now technically a colleague of Thorpe’s as Red Bull’s head of global soccer, became known for raising the issue of playing on Saturday lunchtimes after a Wednesday evening fixture in Europe.
To plan for the particularly challenging festive fixture calendar, Manchester United staff began producing an analysis of every team’s game sequencing over Christmas and New Year. The 2017-2018 edition is shown below, with the shortest recovery periods in shades of red, and the longest in green. Manchester United faced a particularly challenging schedule that season.

“What we found was that it wasn’t really fair,” says Thorpe. “There was a clear performance advantage for teams who didn’t have to play games over a shorter period with less recovery time. And it was clear. So once we’d analysed that for a few years, and saw this was the case, it was (a matter of asking): ‘Well, how do we maximise these scenarios so players perform as well as they can?’.”
Though Manchester United started well in December 2013 (with wins against Aston Villa, West Ham United, Hull City and Norwich City), performances started to slump. They were knocked out of both cups, losing to Swansea in the FA Cup third round (on January 5, 2014), and Sunderland in the League Cup semi-final first leg (on January 7, although they took the tie to penalties after winning the second leg, losing 2-1 at Old Trafford after only three of the 10 spot kicks were scored). They were also beaten in the league by Tottenham Hotspur (on January 1). They ended the period seventh in the table, having won the title the previous season under Sir Alex Ferguson.
In contrast, Manchester City enjoyed a perfect record (aside from having to replay their FA Cup third-round tie, in which they beat Blackburn Rovers 5-0 at the second time of asking), and Chelsea only dropped points with a draw at Arsenal (though they did also lose to Sunderland in the League Cup fifth round).
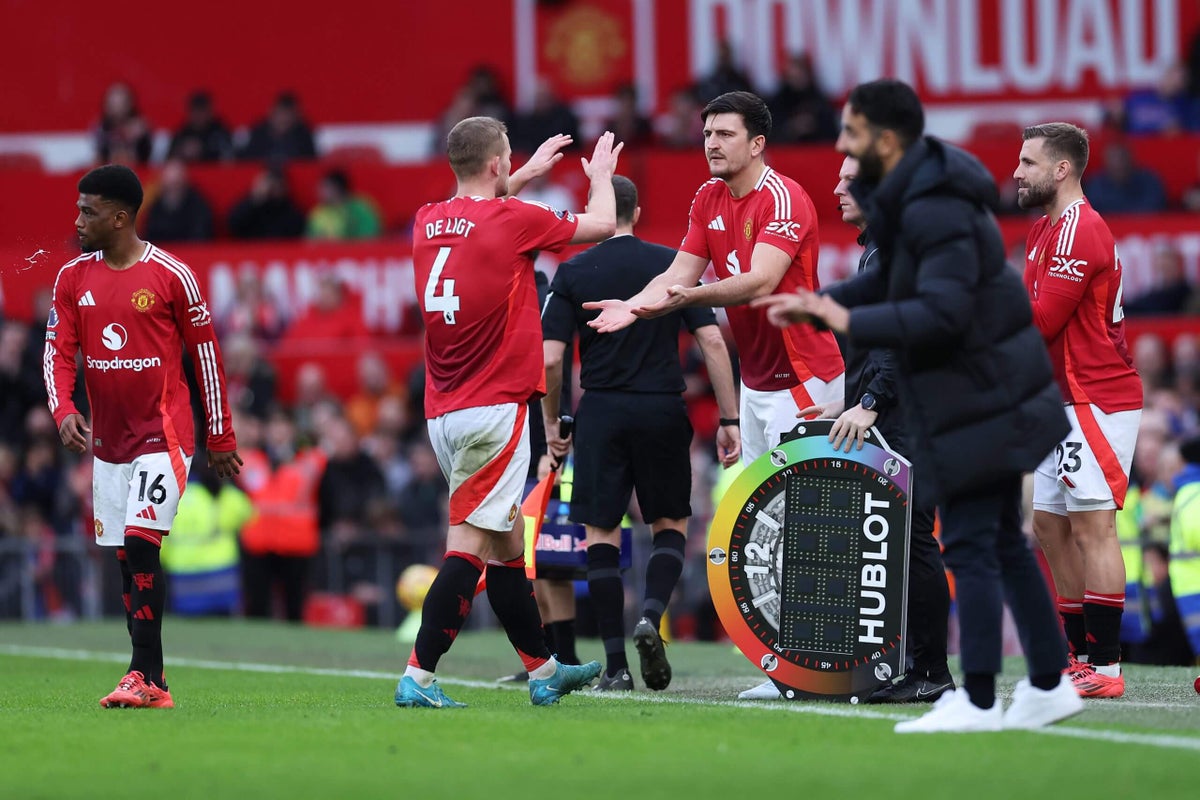
United’s performance science team compared how the three teams used their squads — each club had played the same number of games over the same number of days.
“When we analysed it, it was quite clear that we didn’t rotate the squad as much as Chelsea and City,” explains Thorpe. “We had far more players playing more than four consecutive games, and far fewer playing three to four matches, which seemed to be a manageable sweet spot. We also clearly performed the worst.”
The table below, again supplied to The Athletic, was presented internally at Manchester United to show that their players endured a far higher load than their rivals during periods of challenging game sequencing.

Clearly, more goes into on-field performance than recovery levels. But as they dug deeper, the performance team began to gather clear evidence that, perhaps unsurprisingly, playing a large number of consecutive games, rather than simply playing a large number of games, was a distinguishing factor in teams’ performances.
“We measured the heart rate variability (HRV) of one of the players who had appeared in more than four consecutive games. HRV can be an indication of how the body is responding to load, it’s a reflection of the autonomic nervous system,” says Thorpe. “It’s not something you can try and cheat in a test.
“And we saw with the athlete who had played more than four consecutive games that his ability to recover was actually reduced for a long time thereafter. Not only would we see a potential reduction in performance in the matches, and a possible higher risk of injury, but a potential long-term effect too.
“So, is that type of sequencing actually negative for performance from a chronic perspective as well? Because we found that the athlete, even with two weeks of general training and no match exposure, failed to get back to their previous levels of autonomic function (the body’s involuntary physiological processes). It indicates that you could have a lasting negative effect if they’re not managed and rotated intelligently when it comes to game stress and load.”
Courtesy of Opta, The Athletic ran a similar exercise for last season’s festive period — comparing the rotation levels of the Premier League teams who played in European competition. The numbers still largely back up the rough calculations of a decade ago.

For example, Newcastle United had the most players (eight) who appeared in every game, and endured the second-worst average points total (one, if converting cup results to league points). The number of injuries they had already endured was a factor in this, with Eddie Howe picking from a small first-team squad, which brings a multiplier effect, with uninjured players more likely to be pushed into a fitness red zone because of the lack of rotation.
Arsenal had the worst average points total (0.83), and fielded the joint second-most players in every game (seven). Here, they also had the advantage of playing a game, on average, every 4.3 days, the second-longest time in the dataset. Given Arsenal lost last season’s league title by only two points, they might look back to this period as crucial.
Champions Manchester City had the highest points per game (2.71), and had just two players appear in every game, with only one player starting all seven of their festive fixtures (Jack Grealish). Similarly, Liverpool were the only club to not have a single player start every game — and their points per game of 2.12 was the second-highest of either club.
City and Liverpool are good sides (first and third in the league last year), and again, there is more to success than rotation. However, comparing them to second-placed Arsenal, who rotated far less (an average of 3.0 changes per match, compared to 5.4 for Liverpool and 4.2 to Manchester City) shows a disparity.
In Van Gaal’s reign, the data convinced Manchester United’s staff that rotation was necessary.
“We would do analysis based on months of information, maybe even years of data, where we could quantify player recovery times on average,” explains Thorpe. “Because there will be a point where you’re three games into this critical period, and the head coach obviously wants to use their best players. But then who do you rotate, and when? That’s the next layer to it.
“Using world-class strategies, surveillance or tracking techniques, we could turn around and say: ‘Well, these are the players we know can recover better — in three games across seven days, they should be your core group’. Then you could work out how and when to integrate the others who didn’t have the same recovery profile.
“It’s about helping the head coach make more intelligent decisions about when to rotate — and this has to be thought about more and more because the changes in the schedule are related more to game sequencing than the number of games.”

Van Gaal with his staff in December 2014 (Michael Regan/Getty Images)
Thorpe believes the area merits further research, with recovery monitoring not moving on significantly over the past decade. Despite the number of coaches and players who criticise schedules, little progress has been made in investigating how to manage players during these intense periods.
“Around 2010, there was a lot of original work around performance science,” he explains. “We had applied PhD level work happening at clubs — but that level of work, whether it’s to do with frequently changing managers, different philosophies at clubs, seems to have changed.”
Thorpe wants more clubs to commission this sort of work and for player unions and national governing bodies to become research leaders. He feels that ensuring players are rotated would benefit everyone because fans, managers and broadcasters want to see players at their best. The downside is that a seven-year-old visiting the Emirates for their birthday might be disappointed if Saka is left on the bench for squad rotation. But there is an argument for a different mindset.
Baseball is an extreme example, where it is accepted and understood that starting pitchers must rest for a week after starting to protect their arm. Football does not need to go that far, but our understanding can go one step in that direction. “Everyone wants their best players to appear all the time, but there’s got to be an element of foresight,” says Thorpe. “If your best player is playing more often at 100 per cent of their level, that is intuitively more important than your best player playing at 100 per cent for half the time, and only at 75 per cent for the rest of it.”
Education will be crucial, especially for broadcasters, who help establish the prevailing viewpoint, and who might, instinctively, be against rotation out of a desire for the star names to start every match.
“What we do know is that if you’re going through a game sequencing dilemma and you fail to rotate at the right time, losing a player through injury for a period of weeks, that player will miss more games in total than they would have if they were simply rested,” says Thorpe.
“If you analyse it across a year, it probably makes sense for the broadcasters; the availability of star players is probably aligned to more intelligent rotating and recovery for those athletes.
“Secondly, however you measure the quality of the game, if you have more players appearing at 100 per cent of their capability, it’s logical that you’re going to see better performances and matches.
“It’s important to have a united front on this topic — it’s a win for all parties.”
(Photo: Alex Livesey/Getty Images)


Leave a Reply